压测之sysbench安装和MySQL只读测试
sysbench编译安装
[root@DS-VM-Node160 ~]# cd /tmp/
[root@DS-VM-Node160 /tmp]# git clone https://github.com/akopytov/sysbench.git
[root@DS-VM-Node160 /tmp]# cd sysbench/
[root@DS-VM-Node160 /tmp/sysbench]# yum install mysql mysql-devel libtool openssl-devel openssl-static mysql-community-devel -y
[root@DS-VM-Node160 /tmp/sysbench]# ./configure -V
sysbench configure 0.5
generated by GNU Autoconf 2.69
Copyright (C) 2012 Free Software Foundation, Inc.
This configure script is free software; the Free Software Foundation
gives unlimited permission to copy, distribute and modify it.
[root@DS-VM-Node160 /tmp/sysbench]#
[root@DS-VM-Node160 /tmp/sysbench]# libtoolize --force --copy
[root@DS-VM-Node160 /tmp/sysbench]# ./autogen.sh
[root@DS-VM-Node160 /tmp/sysbench]# ./configure --prefix=/usr/local/sysbench
###如果需要测试PostgreSQL、Oracle,则在configure时需要加上 --with-oracle 或者 --with-pgsql 参数
[root@DS-VM-Node160 /tmp/sysbench]# make -j `awk '/processor/{a }END{print a}' /proc/cpuinfo` && make install
#0.5版本需要oltp.lua测试脚本
#如果是rpm包方式安装的,在 /usr/share/doc/sysbench/tests/db/ 下可找到
[root@DS-VM-Node160 /tmp/sysbench]# cp -ai sysbench/tests /usr/local/sysbench/
[root@DS-VM-Node160 /tmp/sysbench]# echo 'export PATH=/usr/local/sysbench/bin:$PATH' >/etc/profile.d/sysbench.sh
[root@DS-VM-Node160 /tmp/sysbench]# . /etc/profile.d/sysbench.sh
[root@DS-VM-Node160 /tmp/sysbench]# which sysbench && cd
/usr/local/sysbench/bin/sysbench
[root@DS-VM-Node160 /tmp/sysbench]# sysbench --version
sysbench 0.5
sysbench 使用yum安装
[root@DS-VM-Node160 /tmp]# yum install http://www.percona.com/downloads/percona-release/percona-release-0.0-1.x86_64.rpm -y
[root@DS-VM-Node160 /tmp/sysbench]# yum install sysbench -y
使用sysbench测试MySQL
##创建一个压测使用的库
[root@DS-VM-Node160 ~]# mysql -uroot -p******* -h10.10.231.149 -P3317 -e 'SELECT version();'
-----------------------
| version() |
-----------------------
| 10.0.25-MariaDB-wsrep |
-----------------------
[root@DS-VM-Node160 ~]# mysql -uroot -p****** -h10.10.231.149 -P3317 -e 'CREATE DATABASE sysbench;'
[root@DS-VM-Node160 ~]# mysql -uroot -p****** -h10.10.231.149 -P3317 -e "SHOW DATABASES LIKE '%sysbench%';"
-----------------------
| Database (%sysbench%) |
-----------------------
| sysbench |
-----------------------
[root@DS-VM-Node160 ~]#
###创建测试帐户
[root@DS-VM-Node160 ~]# mysql -uroot -p****** -h10.10.231.149 -P3317 -e "GRANT ALL PRIVILEGES ON *.* TO 'sysbench'@'10.%.%.%' IDENTIFIED BY 'lookback';"
[root@DS-VM-Node160 ~]# mysql -uroot -p****** -h10.10.231.149 -P3317 -e "SELECT User,Password,Host FROM mysql.user WHERE User LIKE '%sysbench%';"
---------- ------------------------------------------- ----------
| User | Password | Host |
---------- ------------------------------------------- ----------
| sysbench | *153CCFAEAA83407D8DBDBFAA3D17B1A95553E60C | 10.%.%.% |
---------- ------------------------------------------- ----------
[root@DS-VM-Node160 ~]#
创建测试数据 表中有1kw条 估计大小有2GB
1
[root@DS-VM-Node160 ~]# sysbench --test=oltp --test=/usr/local/sysbench/tests/db/oltp.lua --db-driver=mysql --oltp-table-size=10000000 --mysql-db=sysbench --mysql-user=sysbench --mysql-password=lookback --mysql-host=10.10.231.149 --mysql-port=3317 prepare
###注意最后一个,一项测试开始前需要用prepare来准备好表和数据,run执行真正的压测,cleanup用来清除数据和表。
sysbench 0.5: multi-threaded system evaluation benchmark
生成表的格式
[root@DS-VM-Node160 ~]# mysql -usysbench -plookback -h10.10.231.149 -P3317 -e "SELECT * FROM sysbench.sbtest1 ORDER BY id LIMIT 5;"
---- --------- ------------------------------------------------------------------------------------------------------------------------- -------------------------------------------------------------
| id | k | c | pad |
---- --------- ------------------------------------------------------------------------------------------------------------------------- -------------------------------------------------------------
| 2 | 3718516 | 08566691963-88624912351-16662227201-46648573979-64646226163-77505759394-75470094713-41097360717-15161106334-50535565977 | 63188288836-92351140030-06390587585-66802097351-49282961843 |
| 5 | 5934152 | 05879259692-02024081996-76022818191-82933803603-81845875017-31928300264-16934042125-67052432228-92123768050-95121478647 | 79362588344-09017007031-35411714211-52054317597-26283585383 |
| 8 | 3082941 | 16663631067-14838697989-64358398406-16917073223-47713406217-78812818873-46576803224-61955865221-97956448087-49259465660 | 52468633478-82076178857-68496668227-22002343387-57481185690 |
| 11 | 3371969 | 88814841367-98767826715-60494483894-21079440118-10718401291-33837777683-38627243809-45118876335-22718290515-23426562159 | 79384524915-41356971023-74955511882-92798558059-93482034638 |
| 14 | 4988307 | 87263726817-94340135738-17557808545-78801760644-04111877554-34439976372-12880746592-22897263227-59023974220-20489960934 | 34521232779-81152534024-26776427142-43102257779-39982840334 |
---- --------- ------------------------------------------------------------------------------------------------------------------------- -------------------------------------------------------------
[root@DS-VM-Node160 ~]#
Creating table 'sbtest1'...
Inserting 10000000 records into 'sbtest1'
开始做OLTP只读测试 分别测试1 4 8 16 32 64线程
[root@DS-VM-Node160 ~]# for i in 1 4 8 16 32 64; do sysbench --test=oltp --test=/usr/local/sysbench/tests/db/oltp.lua --db-driver=mysql --oltp-table-size=10000000 --mysql-db=sysbench --mysql-user=sysbench --mysql-password=lookback --mysql-host=10.10.231.149 --mysql-port=3317 --max-time=60 --max-requests=0 --oltp-read-only --oltp-skip-trx --oltp-nontrx-mode=select --oltp-dist-type=uniform --oltp-test-mode=nontrx --report-interval=10 --num-threads=$i run; sleep 10; done
###参数解释
--max-requests=0:压力测试产生请求的总数,如果以下面的max-time来记,这个值设为0
#--max-time=60 压测时间,此处设置为1分钟
#--max-requests=0 limit for total number of requests [10000] "0 是无限制"
#--oltp-read-only=on:表示不产生只读SQL,也就是使用oltp.lua时会采用只读模式。默认 off,如果设置为on,则不会产生update,delete,insert的sql。
#--oltp-nontrx-mode=select 查询类型对于非事务执行模式{select, update_key, update_nokey, insert, delete} [select]
#--num-threads 并发线程数,可以理解为模拟的客户端并发连接数
#--oltp-tables-count=10 表数量
#--oltp-reconnect-mode=STRING 重新连接模式{session(不使用重新连接。每个线程断开只在测试结束),transaction(在每次事务结束后重新连接),query(在每个SQL语句执行完重新连接),random(对于每个事务随机选择以上重新连接模式)}。默认是session
#--oltp-dist-type=uniform:指定随机取样类型,可选值有 uniform(均匀分布), Gaussian(高斯分布), special(空间分布)。默认是special
#--oltp-test-mode=nontrx:执行模式,这里是非事务式的。可选值有simple,complex,nontrx。默认是complex
simple:简单查询,SELECT c FROM sbtest WHERE id=N
complex (advanced transactional):事务模式在开始和结束事务之前加上begin和commit, 一个事务里可以有多个语句,如点查询、范围查询、排序查询、更新、删除、插入等,并且为了不破坏测试表的数据,该模式下一条记录删除后会在同一个事务里添加一条相同的记录。
nontrx (non-transactional):与simple相似,但是可以进行update/insert等操作,所以如果做连续的对比压测,你可能需要重新cleanup,prepare。
#--rand-init=on:是否随机初始化数据,如果不随机化那么初始好的数据每行内容除了主键不同外其他完全相同
#--report-interval=10:表示每10s输出一次测试进度报告
注意,针对不同的选项取值就会有不同的子选项。比如oltp-dist-type=special,就有比如oltp-dist-pct=1、oltp-dist-res=50两个子选项,代表有50%的查询落在1%的行(即热点数据)上,另外50%均匀的(sample uniformly)落在另外99%的记录行上。
再比如oltp-test-mode=nontrx时, 就可以有oltp-nontrx-mode,可选值有select(默认), update_key, update_nokey, insert, delete,代表非事务式模式下使用的测试sql类型。
以上代表的是一个只读的例子,可以把num-threads依次递增(16,36,72,128,256,512),或者调整my.cnf参数,比较效果。另外需要注意的是,大部分mysql中间件对事务的处理,默认都是把sql发到主库执行,所以只读测试需要加上oltp-skip-trx=on来跳过测试中的显式事务。
ps1: 只读测试也可以使用share/tests/db/select.lua进行,但只是简单的point select。
ps2: 我在用sysbench压的时候,在mysql后端会话里有时看到大量的query cache lock,如果使用的是uniform取样,最好把查询缓存关掉。当然如果是做两组性能对比压测,因为都受这个因素影响,关心也不大。
下面是上面语句的测试结果
[root@DS-VM-Node160 ~]# for i in 1 4 8 16 32 64; do sysbench --test=oltp --test=/usr/local/sysbench/tests/db/oltp.lua --db-driver=mysql --oltp-table-size=10000000 --mysql-db=sysbench --mysql-user=sysbench --mysql-password=lookback --mysql-host=10.10.231.149 --mysql-port=3317 --max-time=60 --max-requests=0 --oltp-read-only --oltp-skip-trx --oltp-nontrx-mode=select --oltp-dist-type=uniform --oltp-test-mode=nontrx --report-interval=10 --num-threads=$i run; sleep 10; done
sysbench 0.5: multi-threaded system evaluation benchmark
Running the test with following options:
Number of threads: 1
Report intermediate results every 10 second(s)
Random number generator seed is 0 and will be ignored
Initializing worker threads...
Threads started!
[ 10s] threads: 1, tps: 86.10, reads: 1205.98, writes: 344.39, response time: 12.78ms (95%), errors: 0.00, reconnects: 0.00
[ 20s] threads: 1, tps: 80.30, reads: 1124.00, writes: 321.20, response time: 13.50ms (95%), errors: 0.00, reconnects: 0.00
[ 30s] threads: 1, tps: 80.20, reads: 1122.70, writes: 320.80, response time: 13.72ms (95%), errors: 0.00, reconnects: 0.00
[ 40s] threads: 1, tps: 80.30, reads: 1124.10, writes: 321.20, response time: 13.63ms (95%), errors: 0.00, reconnects: 0.00
[ 50s] threads: 1, tps: 79.70, reads: 1117.00, writes: 319.10, response time: 13.76ms (95%), errors: 0.00, reconnects: 0.00
[ 60s] threads: 1, tps: 78.00, reads: 1091.90, writes: 311.70, response time: 14.22ms (95%), errors: 0.00, reconnects: 0.00
OLTP test statistics:
queries performed:
read: 67858
write: 19388
other: 9694
total: 96940
transactions: 4847 (80.78 per sec.)
read/write requests: 87246 (1454.00 per sec.)
other operations: 9694 (161.56 per sec.)
ignored errors: 0 (0.00 per sec.)
reconnects: 0 (0.00 per sec.)
General statistics:
total time: 60.0040s
total number of events: 4847
total time taken by event execution: 59.9929s
response time:
min: 10.15ms
avg: 12.38ms
max: 112.96ms
approx. 95 percentile: 13.65ms
Threads fairness:
events (avg/stddev): 4847.0000/0.00
execution time (avg/stddev): 59.9929/0.00
sysbench 0.5: multi-threaded system evaluation benchmark
Running the test with following options:
Number of threads: 4
Report intermediate results every 10 second(s)
Random number generator seed is 0 and will be ignored
Initializing worker threads...
Threads started!
[ 10s] threads: 4, tps: 299.69, reads: 4199.52, writes: 1199.48, response time: 15.47ms (95%), errors: 0.00, reconnects: 0.00
[ 20s] threads: 4, tps: 299.70, reads: 4197.30, writes: 1198.90, response time: 14.89ms (95%), errors: 0.00, reconnects: 0.00
[ 30s] threads: 4, tps: 300.90, reads: 4207.30, writes: 1202.80, response time: 15.22ms (95%), errors: 0.00, reconnects: 0.00
[ 40s] threads: 4, tps: 295.20, reads: 4134.80, writes: 1180.90, response time: 15.72ms (95%), errors: 0.00, reconnects: 0.00
[ 50s] threads: 4, tps: 287.30, reads: 4025.80, writes: 1150.10, response time: 16.49ms (95%), errors: 0.00, reconnects: 0.00
[ 60s] threads: 4, tps: 298.90, reads: 4181.90, writes: 1194.60, response time: 16.48ms (95%), errors: 0.00, reconnects: 0.00
OLTP test statistics:
queries performed:
read: 249494
write: 71284
other: 35642
total: 356420
transactions: 17821 (296.96 per sec.)
read/write requests: 320778 (5345.30 per sec.)
other operations: 35642 (593.92 per sec.)
ignored errors: 0 (0.00 per sec.)
reconnects: 0 (0.00 per sec.)
General statistics:
total time: 60.0113s
total number of events: 17821
total time taken by event execution: 239.9966s
response time:
min: 10.87ms
avg: 13.47ms
max: 122.42ms
approx. 95 percentile: 15.66ms
Threads fairness:
events (avg/stddev): 4455.2500/9.44
execution time (avg/stddev): 59.9992/0.00
sysbench 0.5: multi-threaded system evaluation benchmark
Running the test with following options:
Number of threads: 8
Report intermediate results every 10 second(s)
Random number generator seed is 0 and will be ignored
Initializing worker threads...
Threads started!
[ 10s] threads: 8, tps: 485.19, reads: 6799.80, writes: 1941.77, response time: 22.12ms (95%), errors: 0.00, reconnects: 0.00
[ 20s] threads: 8, tps: 481.50, reads: 6744.80, writes: 1926.80, response time: 23.56ms (95%), errors: 0.00, reconnects: 0.00
[ 30s] threads: 8, tps: 480.10, reads: 6715.70, writes: 1918.80, response time: 24.27ms (95%), errors: 0.00, reconnects: 0.00
[ 40s] threads: 8, tps: 452.50, reads: 6340.60, writes: 1811.60, response time: 24.72ms (95%), errors: 0.00, reconnects: 0.00
[ 50s] threads: 8, tps: 480.40, reads: 6722.80, writes: 1921.40, response time: 24.54ms (95%), errors: 0.00, reconnects: 0.00
[ 60s] threads: 8, tps: 485.20, reads: 6796.00, writes: 1942.00, response time: 24.75ms (95%), errors: 0.00, reconnects: 0.00
OLTP test statistics:
queries performed:
read: 401198
write: 114628
other: 57314
total: 573140
transactions: 28657 (477.27 per sec.)
read/write requests: 515826 (8590.92 per sec.)
other operations: 57314 (954.55 per sec.)
ignored errors: 0 (0.00 per sec.)
reconnects: 0 (0.00 per sec.)
General statistics:
total time: 60.0432s
total number of events: 28657
total time taken by event execution: 480.2772s
response time:
min: 11.03ms
avg: 16.76ms
max: 294.31ms
approx. 95 percentile: 24.07ms
Threads fairness:
events (avg/stddev): 3582.1250/9.12
execution time (avg/stddev): 60.0346/0.00
sysbench 0.5: multi-threaded system evaluation benchmark
Running the test with following options:
Number of threads: 16
Report intermediate results every 10 second(s)
Random number generator seed is 0 and will be ignored
Initializing worker threads...
Threads started!
[ 10s] threads: 16, tps: 755.09, reads: 10587.34, writes: 3021.85, response time: 30.39ms (95%), errors: 0.00, reconnects: 0.00
[ 20s] threads: 16, tps: 753.80, reads: 10553.58, writes: 3014.79, response time: 30.25ms (95%), errors: 0.00, reconnects: 0.00
[ 30s] threads: 16, tps: 694.90, reads: 9728.53, writes: 2778.51, response time: 35.96ms (95%), errors: 0.00, reconnects: 0.00
[ 40s] threads: 16, tps: 571.10, reads: 8001.37, writes: 2290.79, response time: 33.51ms (95%), errors: 0.00, reconnects: 0.00
[ 50s] threads: 16, tps: 563.60, reads: 7883.93, writes: 2249.71, response time: 32.86ms (95%), errors: 0.00, reconnects: 0.00
[ 60s] threads: 16, tps: 756.50, reads: 10586.50, writes: 3025.50, response time: 30.67ms (95%), errors: 0.00, reconnects: 0.00
OLTP test statistics:
queries performed:
read: 573524
write: 163864
other: 81932
total: 819320
transactions: 40966 (682.58 per sec.)
read/write requests: 737388 (12286.43 per sec.)
other operations: 81932 (1365.16 per sec.)
ignored errors: 0 (0.00 per sec.)
reconnects: 0 (0.00 per sec.)
General statistics:
total time: 60.0165s
total number of events: 40966
total time taken by event execution: 960.0691s
response time:
min: 12.99ms
avg: 23.44ms
max: 2295.61ms
approx. 95 percentile: 32.15ms
Threads fairness:
events (avg/stddev): 2560.3750/33.23
execution time (avg/stddev): 60.0043/0.01
sysbench 0.5: multi-threaded system evaluation benchmark
Running the test with following options:
Number of threads: 32
Report intermediate results every 10 second(s)
Random number generator seed is 0 and will be ignored
Initializing worker threads...
Threads started!
[ 10s] threads: 32, tps: 891.19, reads: 12504.40, writes: 3568.44, response time: 54.01ms (95%), errors: 0.00, reconnects: 0.00
[ 20s] threads: 32, tps: 998.60, reads: 13975.92, writes: 3992.61, response time: 51.92ms (95%), errors: 0.00, reconnects: 0.00
[ 30s] threads: 32, tps: 962.60, reads: 13476.78, writes: 3849.79, response time: 48.25ms (95%), errors: 0.00, reconnects: 0.00
[ 40s] threads: 32, tps: 1046.50, reads: 14653.70, writes: 4187.60, response time: 46.25ms (95%), errors: 0.00, reconnects: 0.00
[ 50s] threads: 32, tps: 1009.70, reads: 14140.21, writes: 4036.90, response time: 47.09ms (95%), errors: 0.00, reconnects: 0.00
[ 60s] threads: 32, tps: 966.20, reads: 13520.91, writes: 3865.00, response time: 49.98ms (95%), errors: 0.00, reconnects: 0.00
OLTP test statistics:
queries performed:
read: 822920
write: 235120
other: 117560
total: 1175600
transactions: 58780 (978.89 per sec.)
read/write requests: 1058040 (17620.08 per sec.)
other operations: 117560 (1957.79 per sec.)
ignored errors: 0 (0.00 per sec.)
reconnects: 0 (0.00 per sec.)
General statistics:
total time: 60.0474s
total number of events: 58780
total time taken by event execution: 1920.5471s
response time:
min: 14.57ms
avg: 32.67ms
max: 732.59ms
approx. 95 percentile: 49.49ms
Threads fairness:
events (avg/stddev): 1836.8750/27.39
execution time (avg/stddev): 60.0171/0.01
sysbench 0.5: multi-threaded system evaluation benchmark
Running the test with following options:
Number of threads: 64
Report intermediate results every 10 second(s)
Random number generator seed is 0 and will be ignored
Initializing worker threads...
Threads started!
[ 10s] threads: 64, tps: 1094.98, reads: 15400.07, writes: 4391.91, response time: 101.24ms (95%), errors: 0.00, reconnects: 0.00
[ 20s] threads: 64, tps: 1052.40, reads: 14737.81, writes: 4204.60, response time: 106.62ms (95%), errors: 0.00, reconnects: 0.00
[ 30s] threads: 64, tps: 1129.60, reads: 15817.40, writes: 4522.60, response time: 98.67ms (95%), errors: 0.00, reconnects: 0.00
[ 40s] threads: 64, tps: 956.60, reads: 13404.34, writes: 3840.78, response time: 111.78ms (95%), errors: 0.00, reconnects: 0.00
[ 50s] threads: 64, tps: 1088.30, reads: 15224.31, writes: 4339.80, response time: 102.06ms (95%), errors: 0.00, reconnects: 0.00
[ 60s] threads: 64, tps: 1135.50, reads: 15880.44, writes: 4535.51, response time: 101.39ms (95%), errors: 0.00, reconnects: 0.00
OLTP test statistics:
queries performed:
read: 904932
write: 258552
other: 129276
total: 1292760
transactions: 64638 (1076.69 per sec.)
read/write requests: 1163484 (19380.45 per sec.)
other operations: 129276 (2153.38 per sec.)
ignored errors: 0 (0.00 per sec.)
reconnects: 0 (0.00 per sec.)
General statistics:
total time: 60.0339s
total number of events: 64638
total time taken by event execution: 3841.3044s
response time:
min: 16.69ms
avg: 59.43ms
max: 1045.31ms
approx. 95 percentile: 103.48ms
Threads fairness:
events (avg/stddev): 1009.9688/19.97
execution time (avg/stddev): 60.0204/0.01
[root@DS-VM-Node160 ~]#
<center>
 </center>
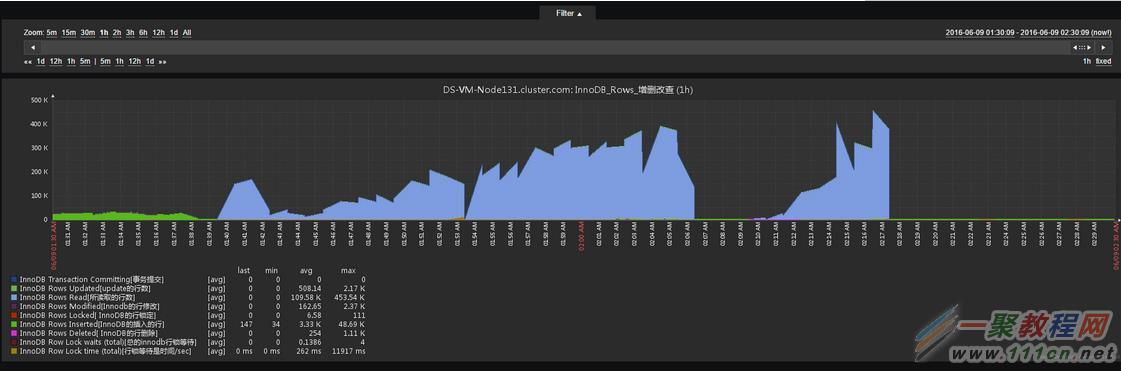
 我们一般关注的用于绘图的指标主要有:
response time avg: 平均响应时间。(后面的95%的大小可以通过--percentile=98的方式去更改)
transactions: 精确的说是这一项后面的TPS 。但如果使用了-oltp-skip-trx=on,这项事务数恒为0,需要用total number of events 去除以总时间,得到tps(其实还可以分为读tps和写tps)
read/write requests: 用它除以总时间,得到吞吐量QPS
当然还有一些系统层面的cpu,io,mem相关指标
您可能感兴趣的文章:
压测之sysbench安装和MySQL只读测试
MYSQL压力测试工具sysbench安装测试详解
mysql压力测试工具mysqlslap测试
sysbench压测之MySQL压测的例子
bind 压力测试软件 queryperf
CentOS6.2下安装与配置Mysql5.5
压测介绍-go实现的压测工具【单台机器100w连接压测实战】
:first-child和:last-child学习笔记
压测工具如何选择? ab、locust、Jmeter、go压测工具【单台机器100w连接压测实战】
Nysql中InnoDB隔离模式对数据库性能有何影响